
Tracking & Outcomes
Using Advanced Tracking & Outcome Measures
Advanced Tracking lets you quantify patient progress with standardized clinical tests and objective data. Log scores over time and ClinikaPath turns them into trend charts, % to goal, combined comparisons, and exportable reports.
8 sections
~5 min
Updated April 2026
Open Advanced Tracking
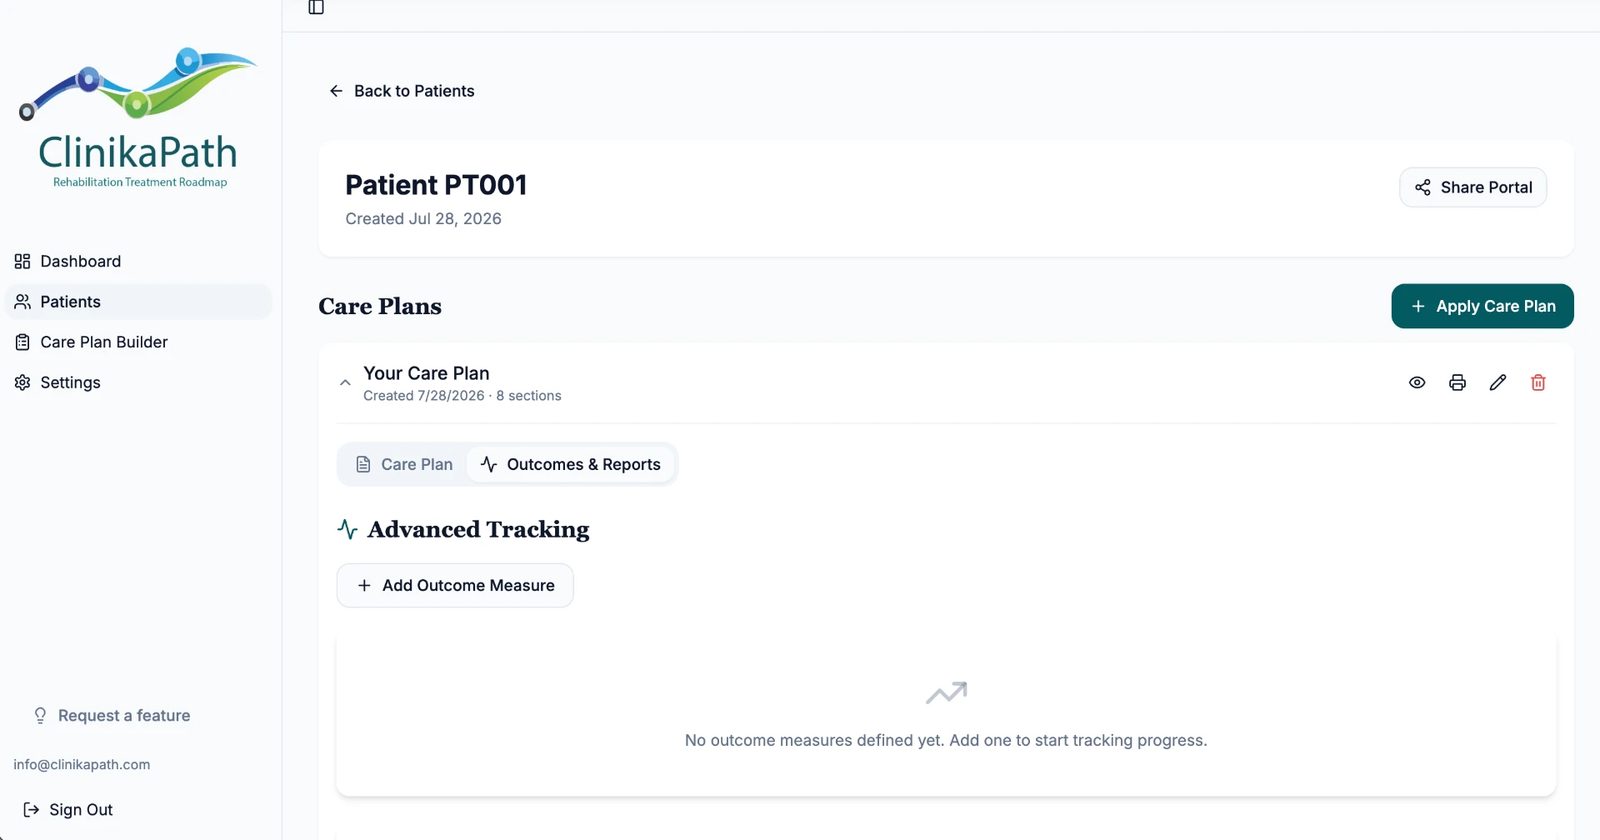
Advanced Tracking lives inside each care plan on the patient profile:
- Open the patient (e.g. Patient PT001) from Patients.
- Expand the care plan card and switch to the Outcomes & Reports tab.
- Under Advanced Tracking, click + Add Outcome Measure. Until then you'll see "No outcome measures defined yet."
Define the measure
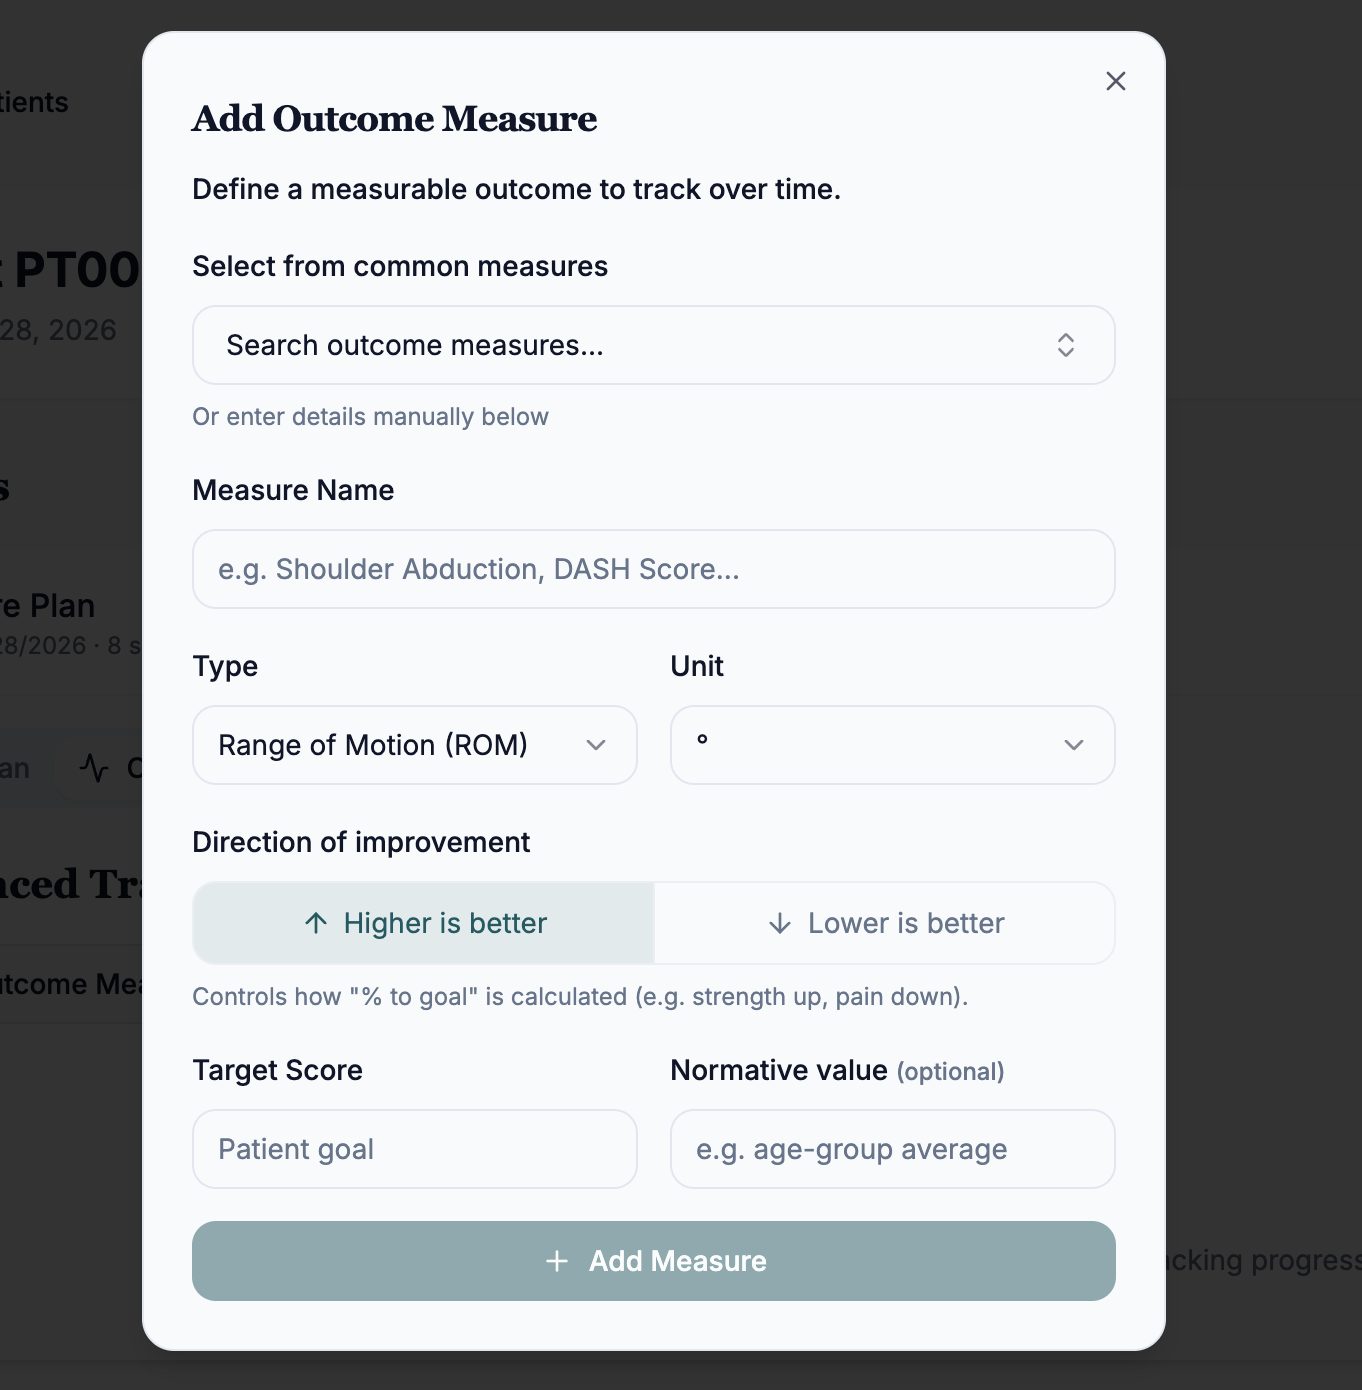
The Add Outcome Measure dialog lets you define a metric to track over time:
- Measure Name: type your own name (e.g. Shoulder Abduction, DASH Score).
- Type & Unit: pick a category such as Range of Motion (ROM) and the matching unit (°, cm, kg, score…).
- Direction of improvement: choose Higher is better or Lower is better — this controls how "% to goal" is calculated.
- Target Score and an optional Normative value (e.g. age-group average).
Use the validated measures library
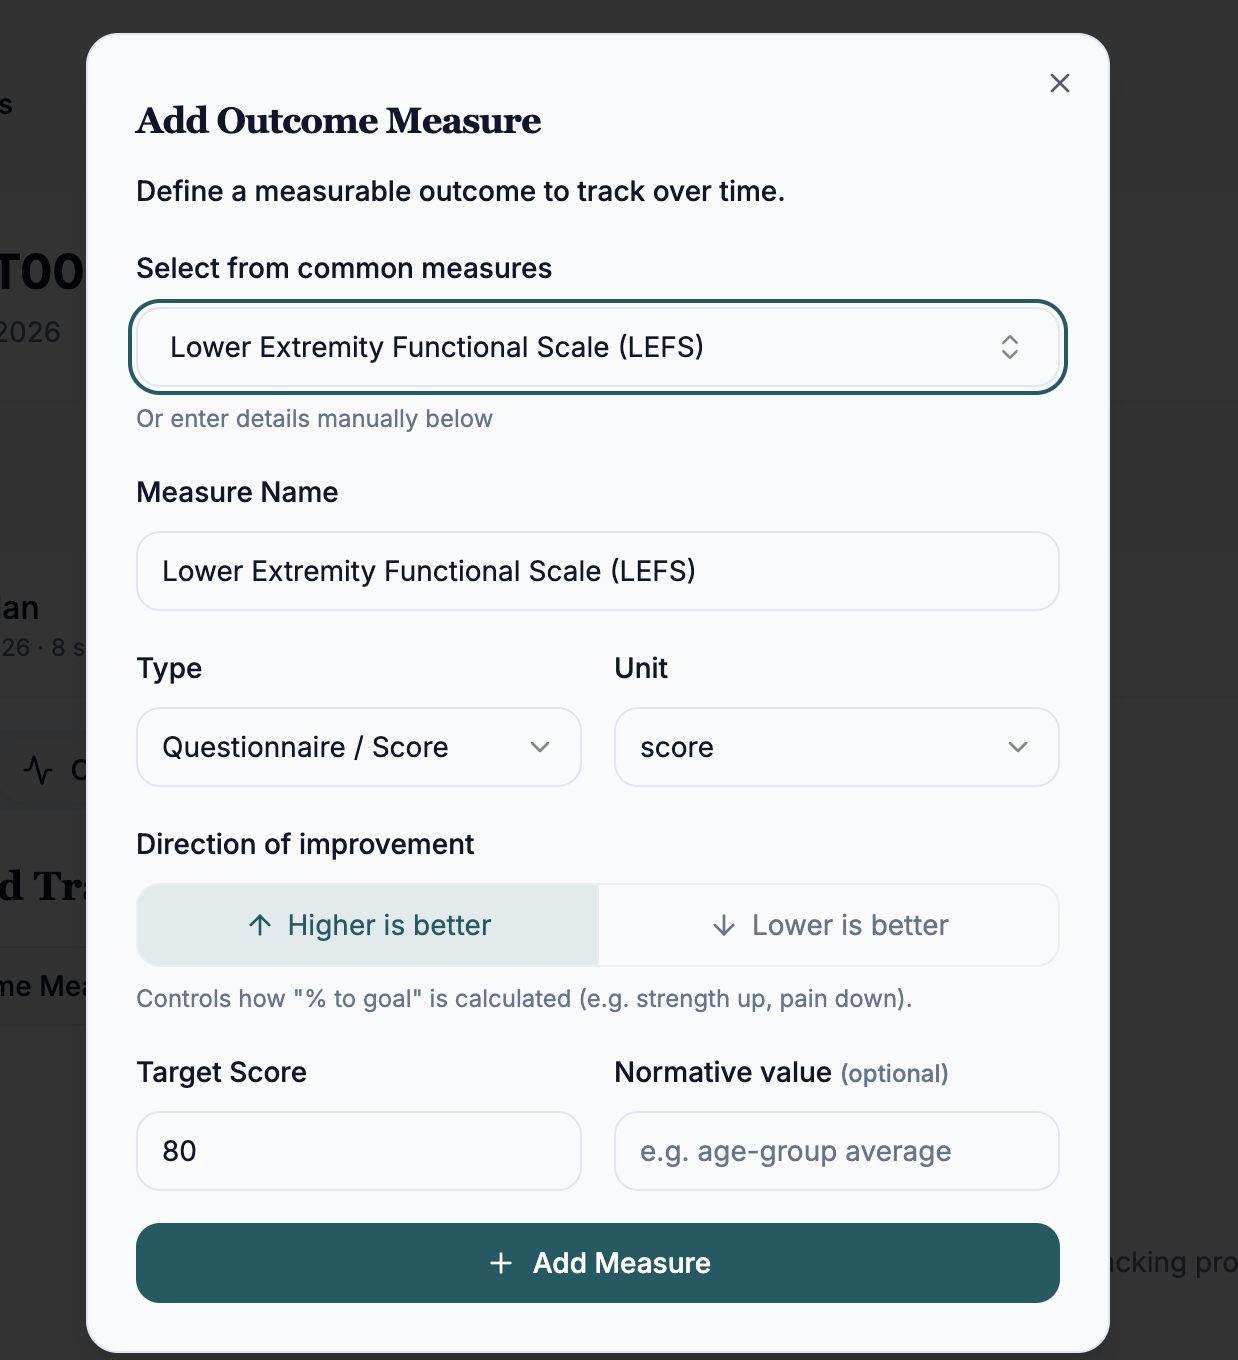
Instead of typing everything manually, use Select from common measures:
- Search and pick a validated test — for example the Lower Extremity Functional Scale (LEFS).
- The name, type (Questionnaire / Score) and unit are filled in automatically.
- Enter the Target Score (e.g. 80) and click + Add Measure to save it.
Log a new score
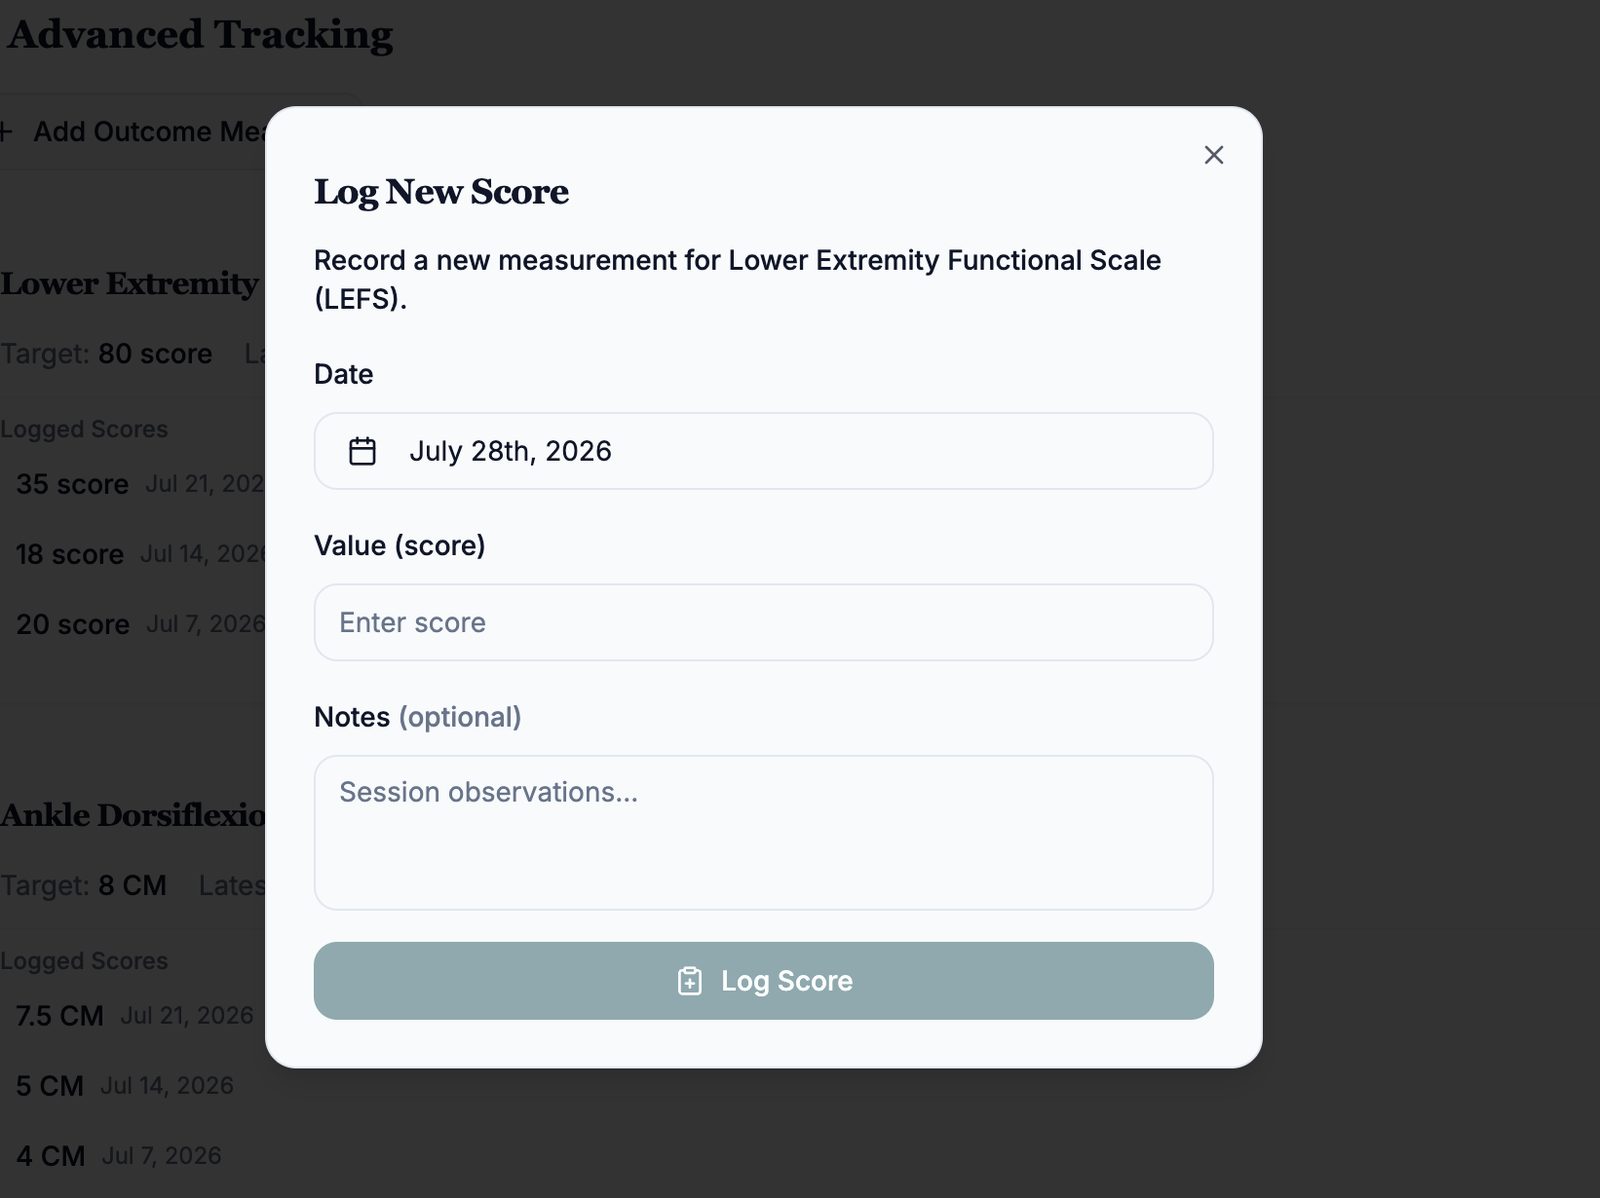
Record a data point after each assessment or session:
- Click Log Score on the measure card.
- Date: choose the day the test was performed.
- Value: enter the numeric result in the measure's unit.
- Notes (optional): add session observations.
- Each measure keeps a Logged Scores history so you can see every entry at a glance.
Read the Outcome Measures dashboard
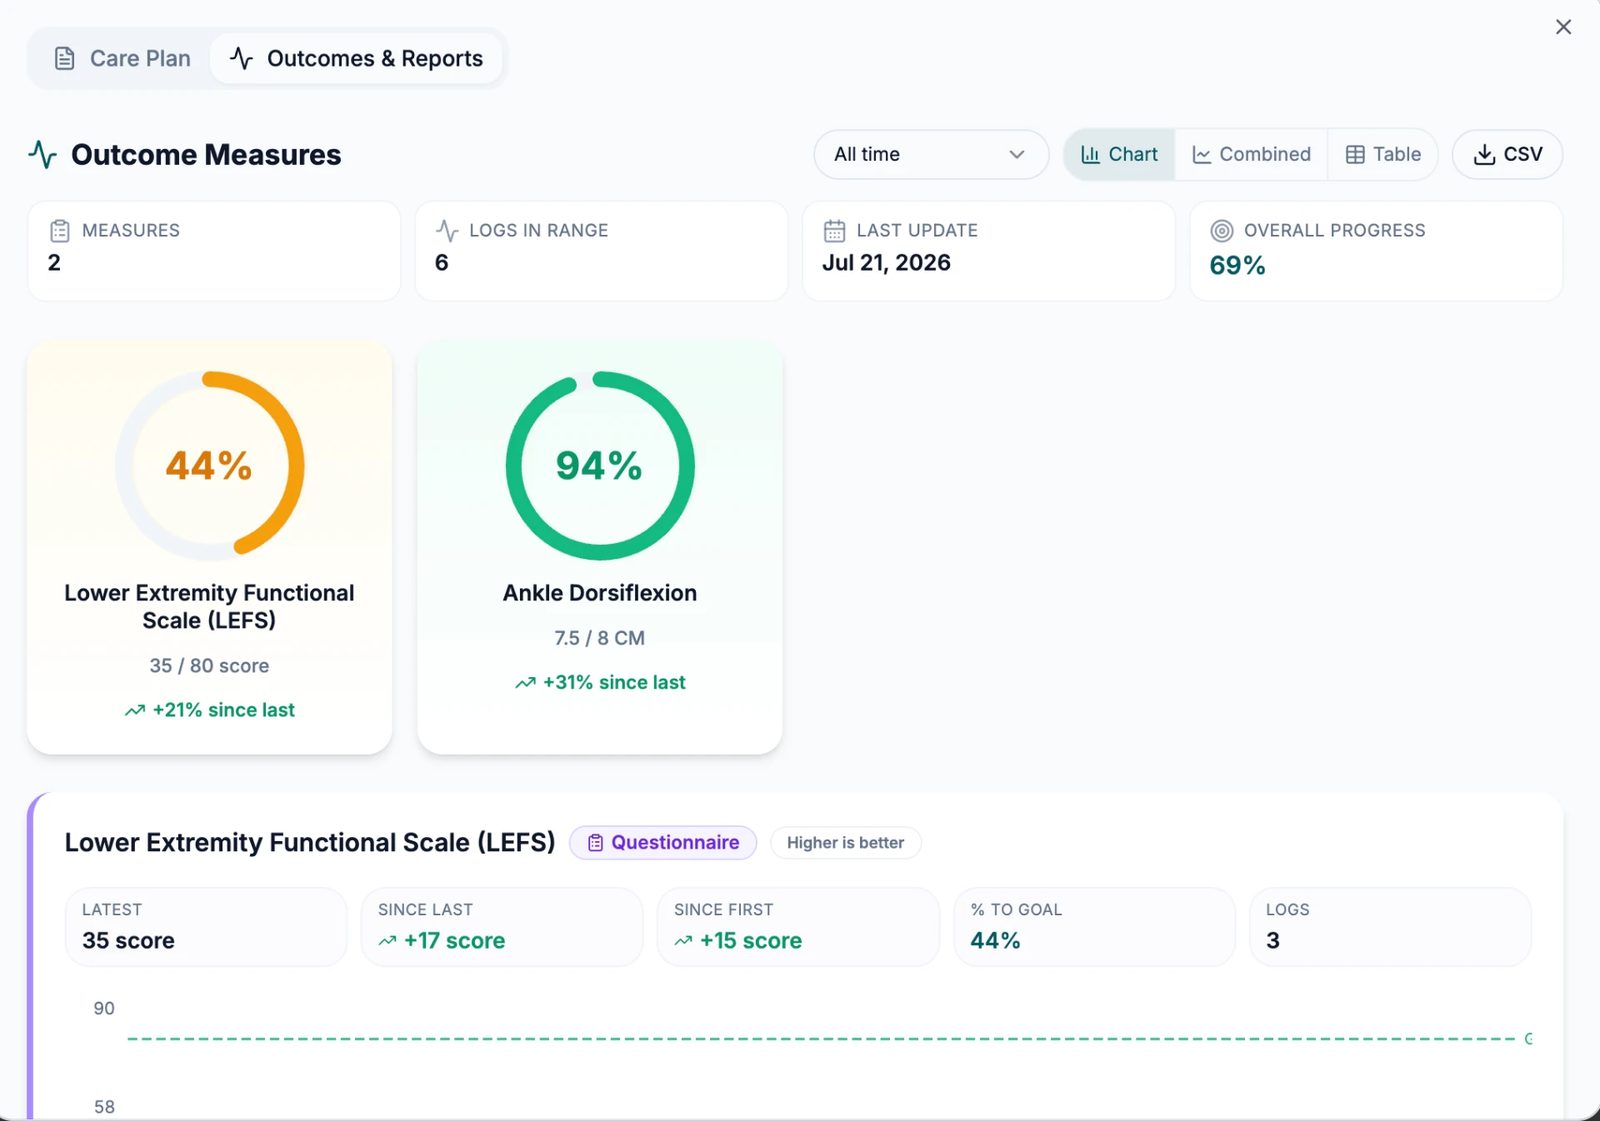
The Outcomes & Reports tab summarises everything you've logged:
- Top cards show Measures, Logs in range, Last update and Overall progress.
- Each measure gets a progress ring with the latest value versus the target and the change since the last log.
- Use the time-range dropdown (All time) and the Chart / Combined / Table switcher, or export everything with CSV.
Analyze individual trend charts
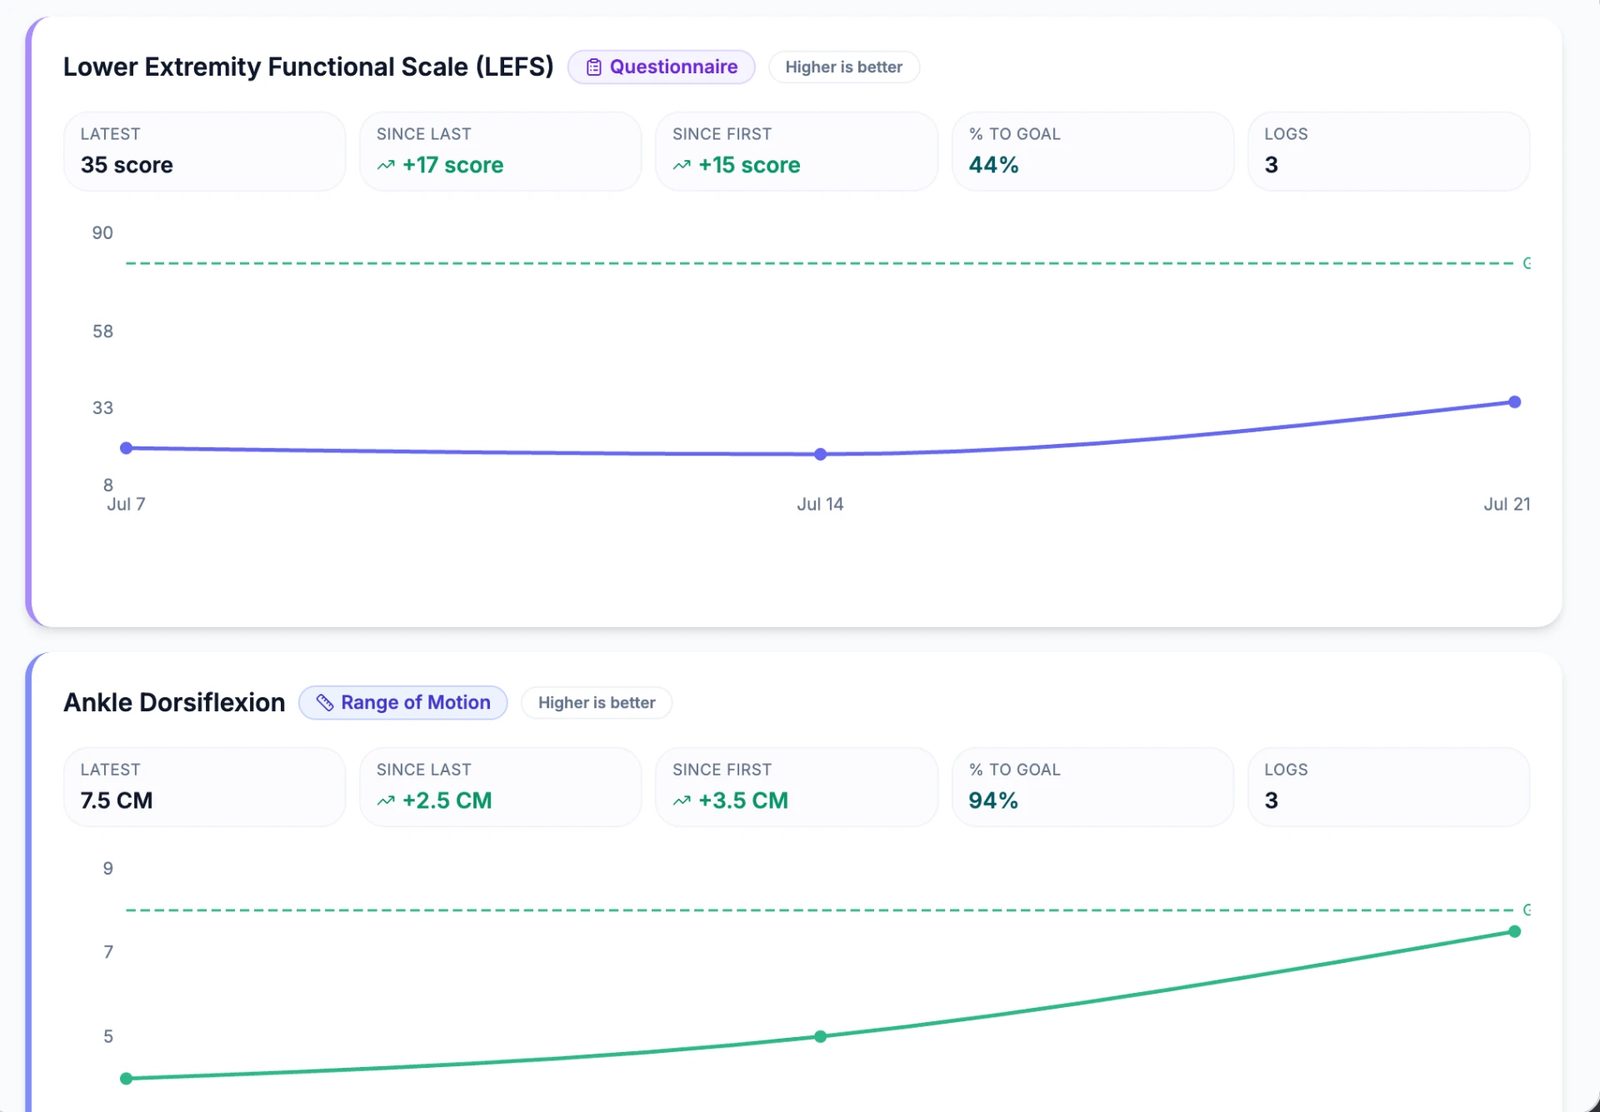
The Chart view plots one card per measure:
- Stat tiles show Latest, Since last, Since first, % to goal and the number of Logs.
- The solid line is the patient's trend; the green dashed line is the target score.
- Badges remind you of the measure type and whether higher or lower is better.
Compare measures with Combined Trends
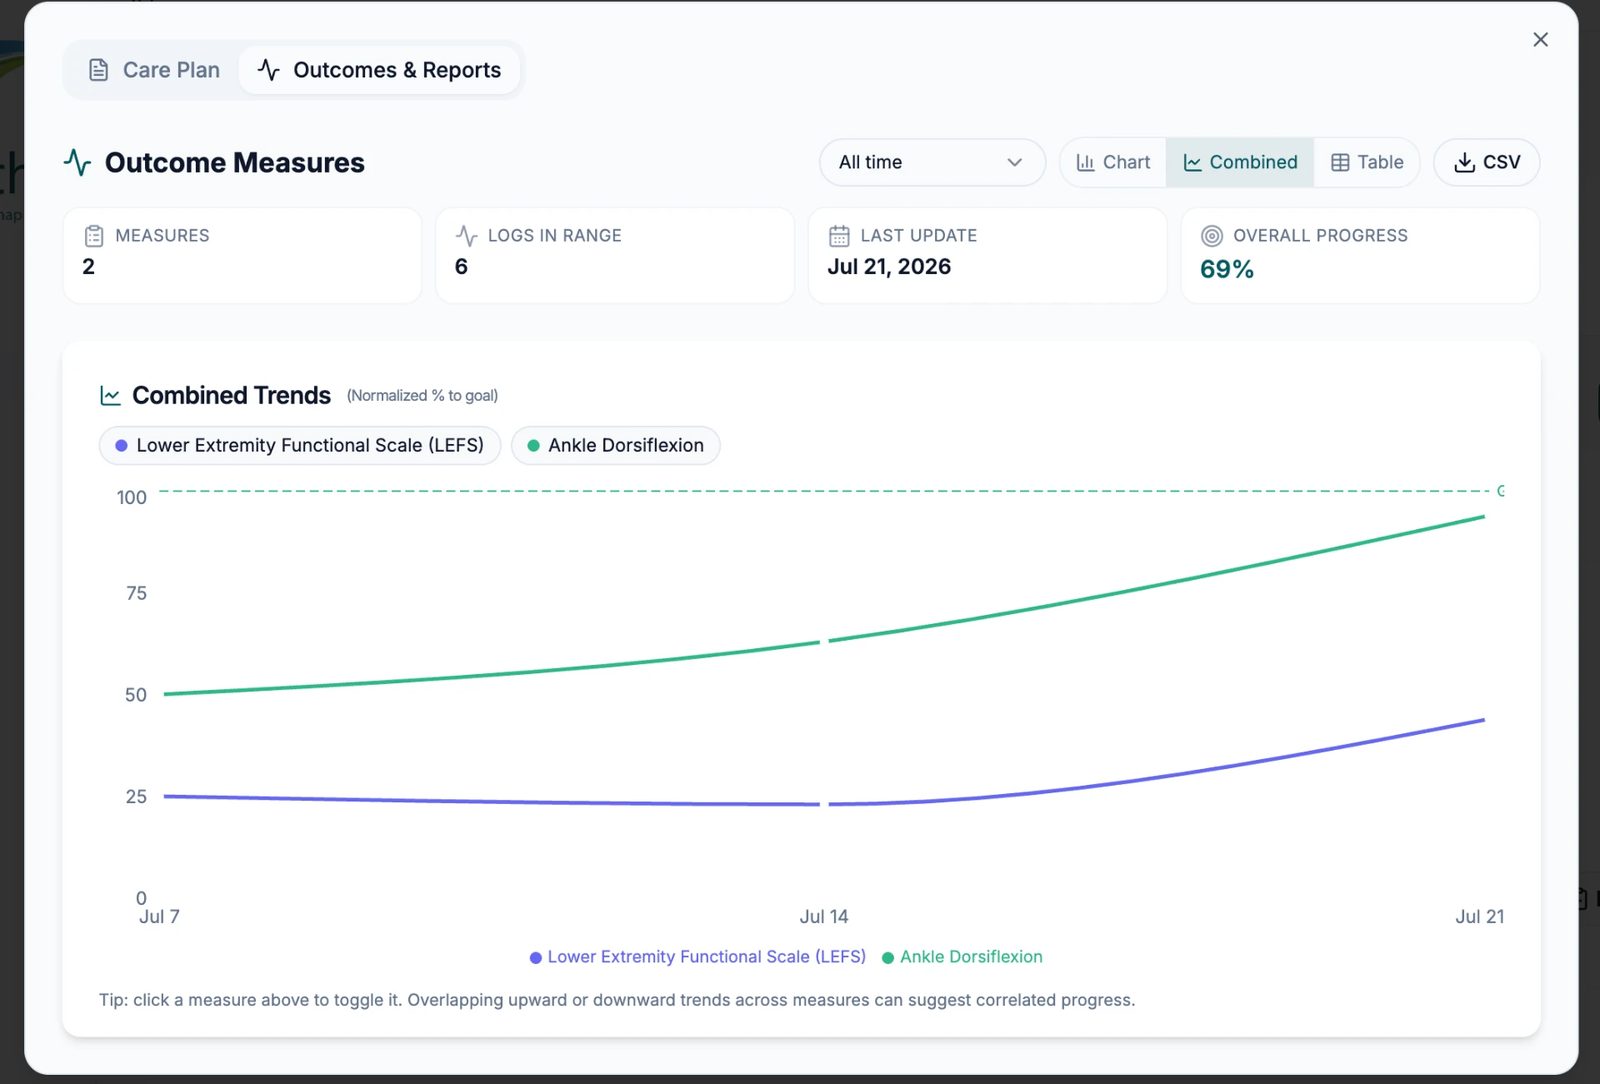
Switch to Combined to overlay every measure on one normalized "% to goal" scale:
- Click a measure chip to show or hide its line.
- Overlapping upward or downward trends can suggest correlated progress across measures.
Review the summary table & export
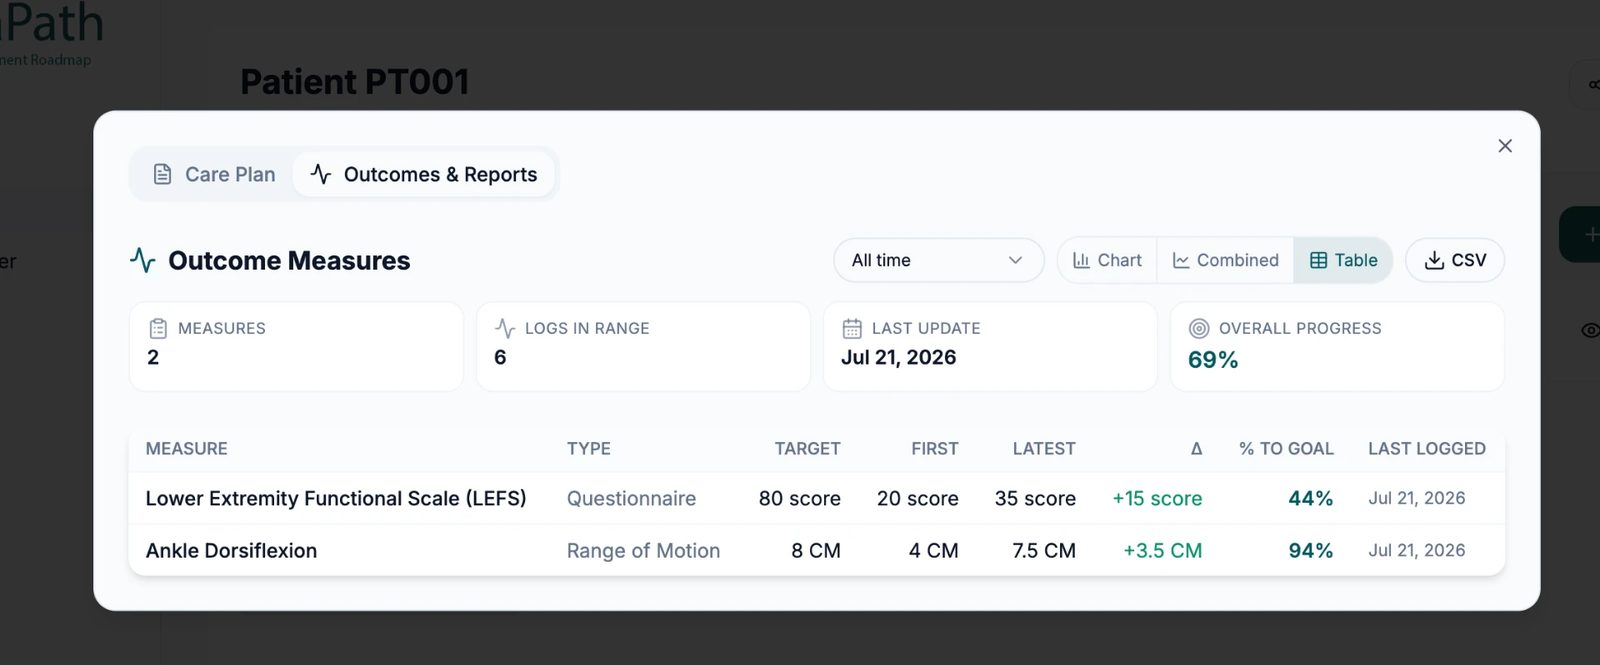
The Table view gives a compact clinical summary: measure, type, target, first and latest values, the delta, % to goal and the last logged date.
Click CSV to download the same data for reporting, insurers, or your own records.
Quick tips for clinic owners
- Visual buy-in: show these charts during follow-ups. Watching the trend line climb toward the dashed goal line is a powerful motivator for adherence.
- Pick the right direction: set "Lower is better" for pain or time-based tests so the % to goal stays accurate.
- Data cleanup: if a measure was added in error, delete it from its card — this removes the measure and all its logged scores.